 Cairn
Cairn
Knowledge Graph
A workspace-level view that surfaces every relationship between your projects, notes, tasks, and tags. Two visualisation modes, click-to-navigate, and full MCP access for AI research traversal.
What is the Knowledge Graph?
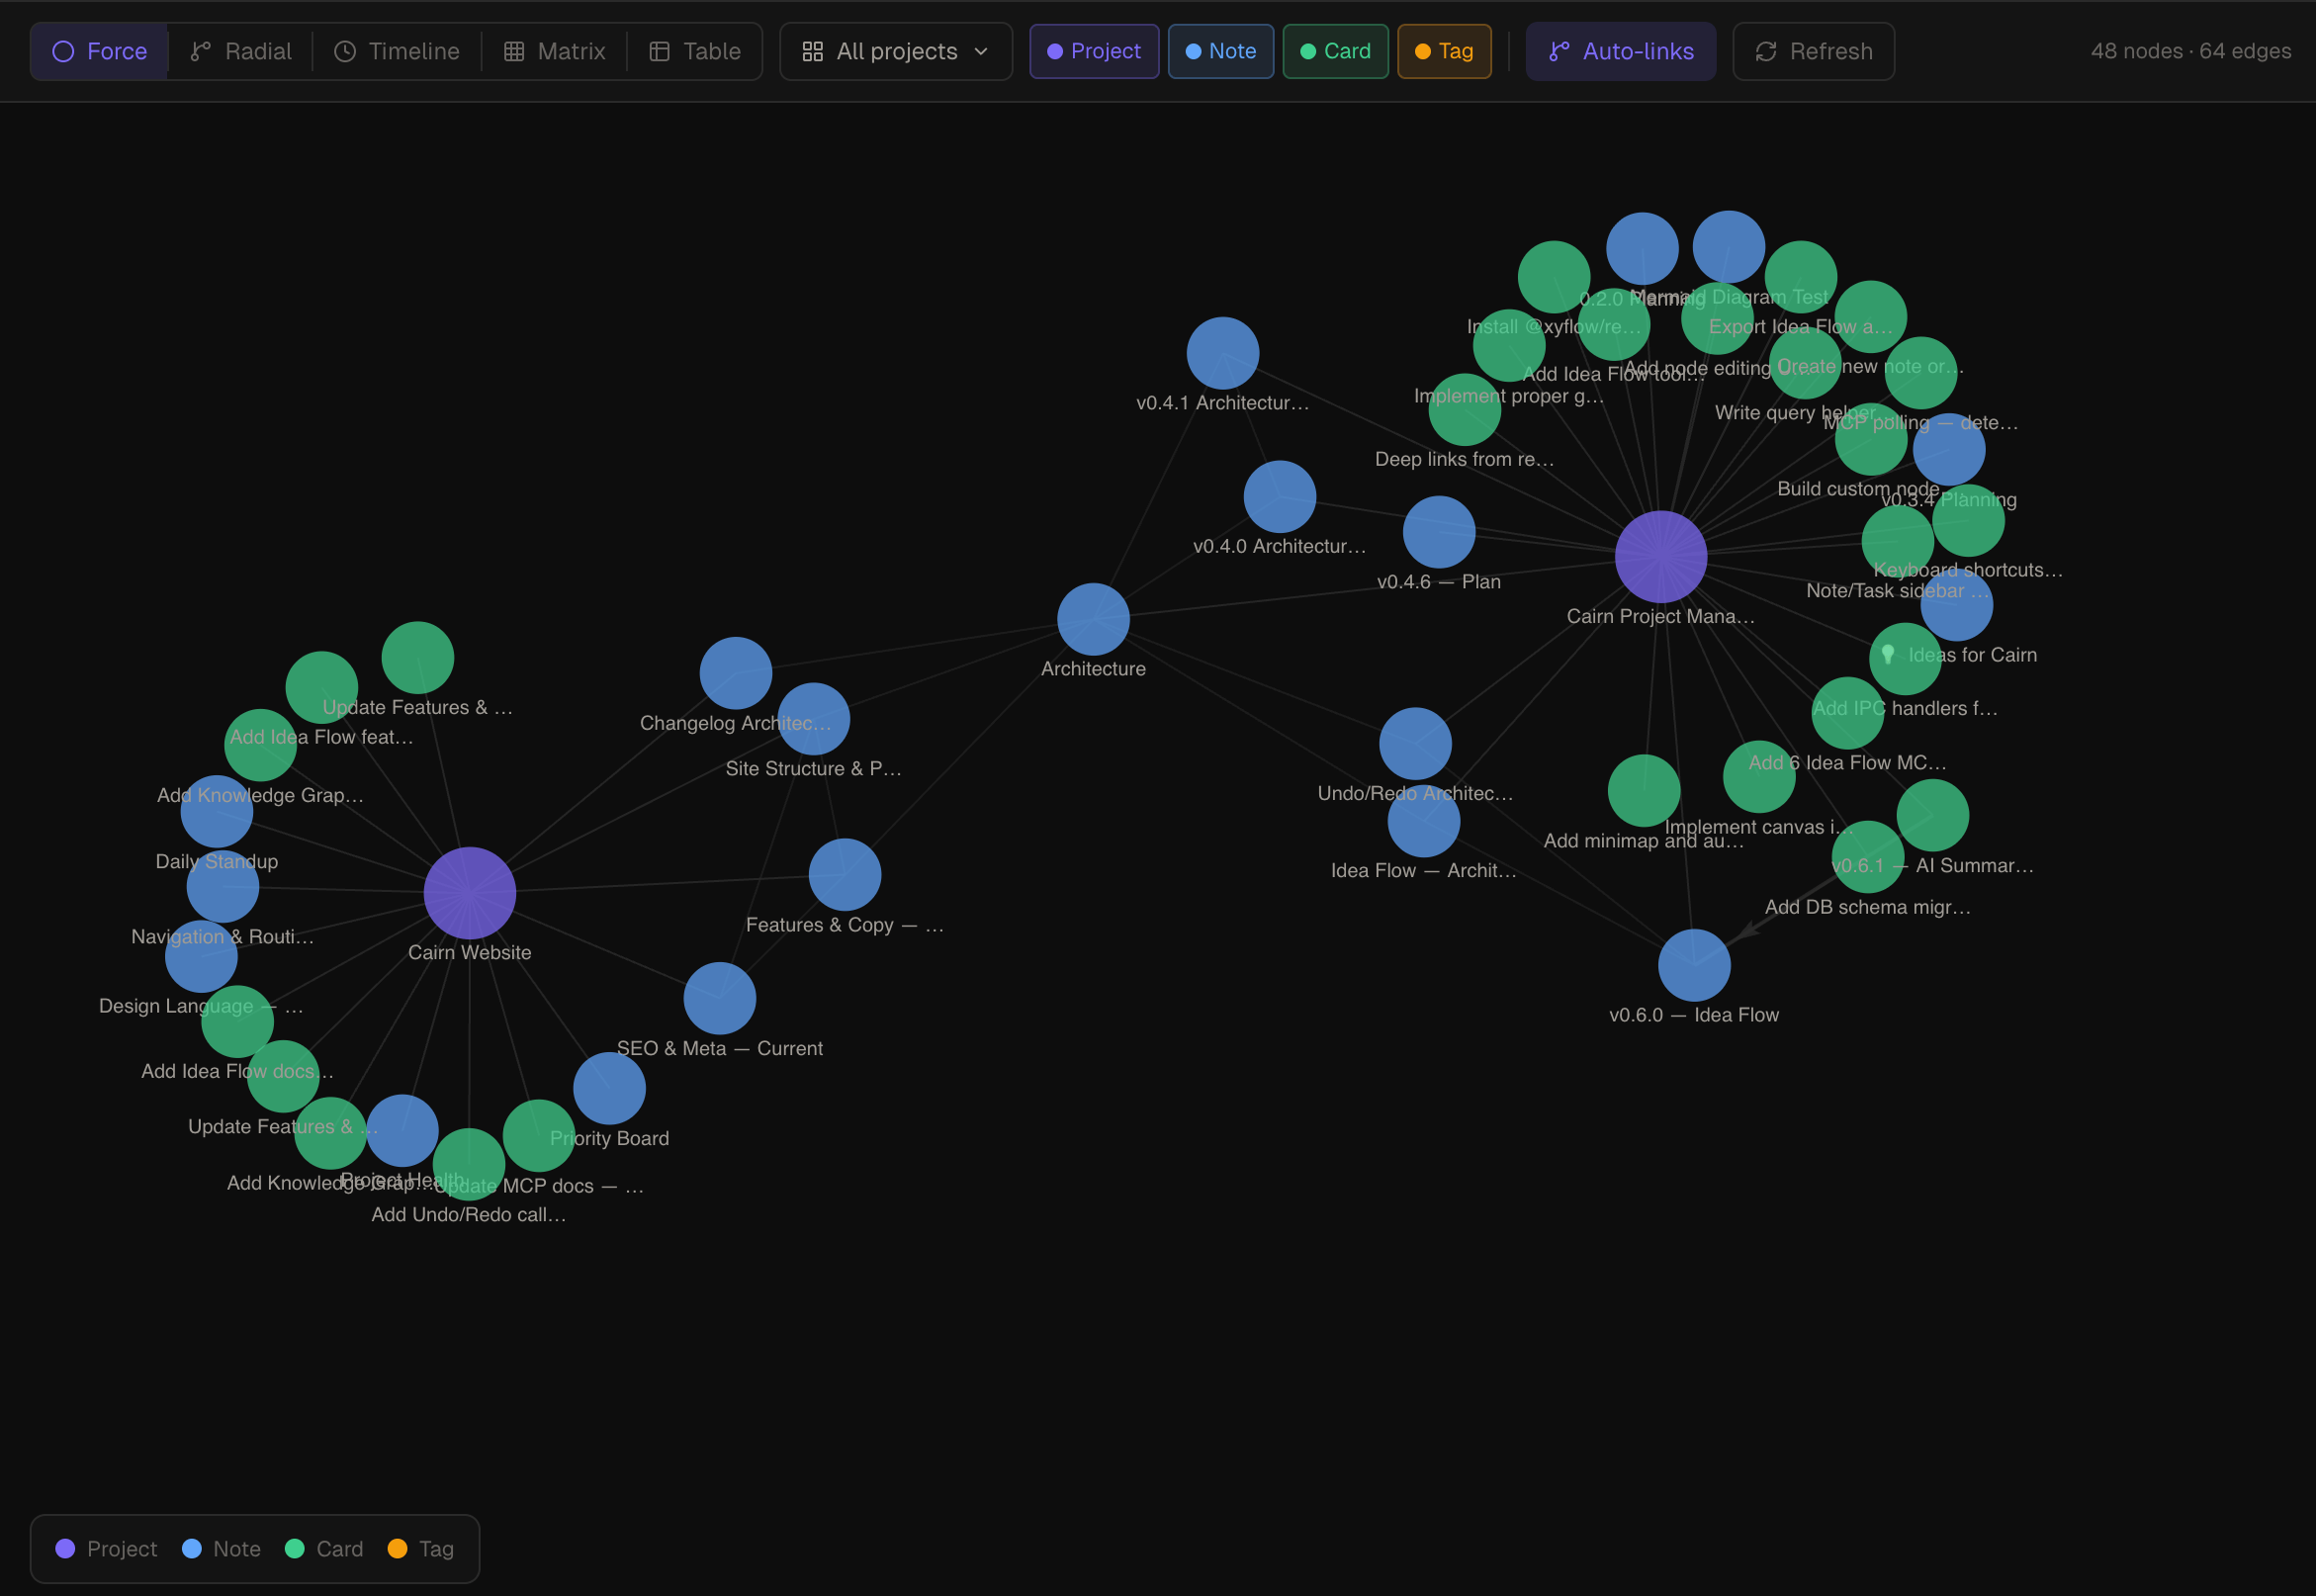
The Knowledge Graph is a workspace-wide view — not scoped to a single project. It maps every entity (projects, notes, tasks, tags) and every relationship between them: explicit links you've created, co-mentions detected automatically, shared tags, and more.
Unlike Idea Flow (which is a per-project freeform canvas), the Knowledge Graph is read-oriented — it helps you explore and understand what exists across your entire workspace. You can click any node to open a detail panel and navigate directly to the source.
Opening the Knowledge Graph
Click Knowledge Graph in the bottom section of the left sidebar (below the project list, above Settings). The keyboard shortcut is Cmd 6. The view loads all entities across all projects in the active workspace.
Visualisation modes
Switch between two modes using the mode selector in the toolbar:
| Mode | Description |
|---|---|
| Force graph | A raw D3 canvas layout that stays responsive on large graphs. Nodes repel and edges act as springs, and each project's members are wrapped in a soft convex-hull outline (toggleable via the Hulls control). Best for exploring unknown structure. |
| Radial (sunburst) | A drill-down sunburst: Workspace at the centre, projects and a shared Tags branch around it, notes and cards on the outer ring. Click a branch to drill in (rings expand with readable labels) and the hub or breadcrumb to zoom back out — smoothly animated both ways. |
These views moved to the Insights view (Cmd 7) in v0.7.4, alongside four new analytics canvases.
Navigating the graph
- Click any node — opens a detail panel on the right showing the entity's title, type, project, and key metadata
- Click to spotlight — clicking a tag highlights every note and card carrying it; clicking any other item highlights everything linked to it. The selection glows in the accent colour while everything else dims. Click the background to clear.
- Click "Open" in the detail panel — navigates to the entity in its native view (note in Notes, task in Board)
- Scroll to zoom — standard canvas zoom in force graph and radial tree modes
- Drag to pan — click and drag the canvas background
- Hover a node — highlights all direct edges; dims unconnected nodes
- Search nodes (⌘F) — focuses the search input in the toolbar; type to highlight matching nodes by name
Filtering
Use the filter panel (toolbar, right side) to narrow what's shown:
- By project — show entities from selected projects only
- By node type — show only notes, only tasks, only projects, or any combination
- By relationship type — show only explicit links, only auto-discovered relationships, or both
Filters apply across both visualisation modes. The active filter state is preserved when you switch modes.
Auto-discovered relationships
In addition to explicit links you create (note-to-task links, MCP-created edges), Cairn automatically detects several types of relationships:
- Co-mentions — a note that references another note's title by name
- Keyword similarity — entities sharing significant overlapping terms in their content (Jaccard similarity)
- Shared assignees — tasks assigned to the same person across different projects
- Semantic similarity — notes related by meaning, via a local, offline embedding model (a distinct "semantic" edge type); hovering a semantic link shows the two note/section titles and the similarity percentage
Tags appear as their own nodes in the graph with edges to all tagged entities — this is structural, not auto-discovered.
Auto-discovered relationships are shown with a dashed edge style to distinguish them from explicit links. Toggle them off via the relationship type filter if you want to see only your intentional connections.
Relationship detection runs when the Knowledge Graph view opens. It does not run continuously in the background. Re-open the view to pick up changes made since it was last loaded.
MCP tool reference
Two MCP tools expose the Knowledge Graph to AI clients and external scripts:
| Tool | Read / Write | Description |
|---|---|---|
get_knowledge_graph |
Read | Returns the full workspace relationship graph as {nodes, edges}. Optional projectIds array to scope to specific projects. includeAuto flag (default: true) controls whether auto-discovered relationships are included. |
get_neighbors |
Read | N-hop breadth-first traversal from any node. Args: workspaceId, nodeId, depth (1–3). Returns all nodes and edges reachable within the specified number of hops. Useful for incremental research without loading the full graph. |
When an AI client needs to explore context around a specific note or task, get_neighbors with depth: 1 or depth: 2 is more efficient than loading the full graph. Start from a known node ID and expand outward only as needed.